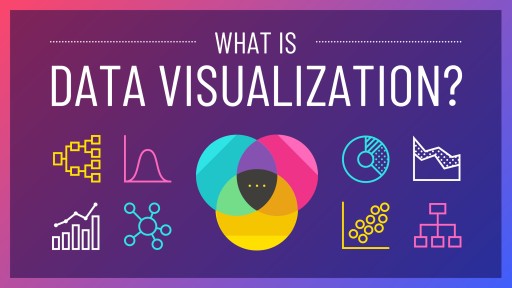
Making Research Useful Data Visualization to Create Reports
Learn how to create beautiful reports using intutive visualizations in your reasearch. Visualizations helps audience and reasearchers to find patterns in data. Data Visualization is a powerful tool for qualitative reporting. Visual elements, like graphics, not only break up the monotony of long text pages in the reports, but they also communicate the information in an interesting way. This helps readers understand things quickly and makes the data more memorable. However, it is helpful only if done right. If you go through the trouble to create a report, but no one finds it interesting or don’t want to